When I study nature, I love to learn about the superlatives. I appreciate how the tallest mountains, the biggest trees, or the oldest animals have a way to serve as ambassadors, helping people to appreciate the natural world even if they don’t understand the “nitty-gritty” science of everything. It’s with this mindset that I set off onto an interesting study of the huge role beavers play in the BWCA. One of my favorite places in the whole wide world is the BWCA. In my time guiding and taking personal trips, I am consistently looking for new lenses through which to appreciate it and, in turn, help others to love it more too. And beavers are a huge part of the BWCA being the way it is today.
In my study, I primarily set out with two goals:
“What does the impact of beavers look like on a landscape level?”
and “What are beavers capable of building? How big can they build?”
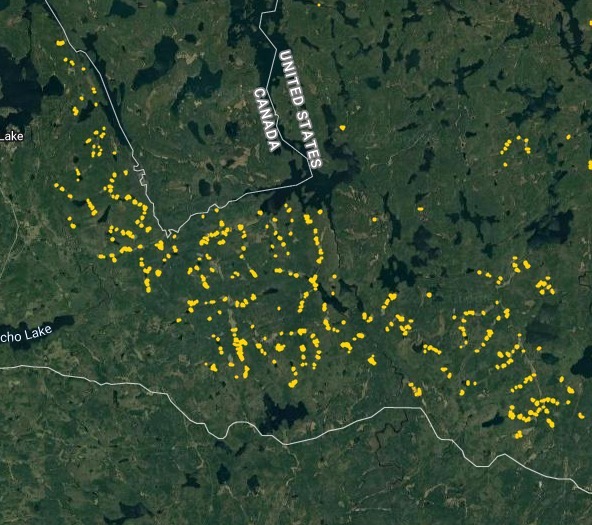
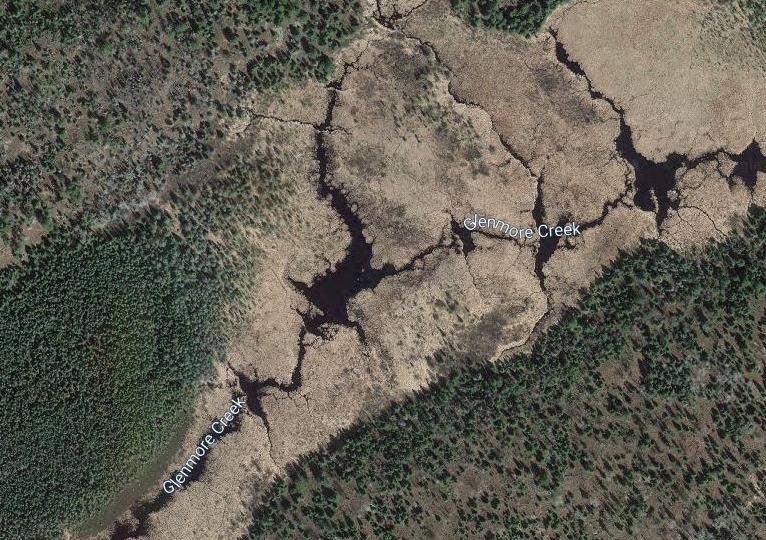
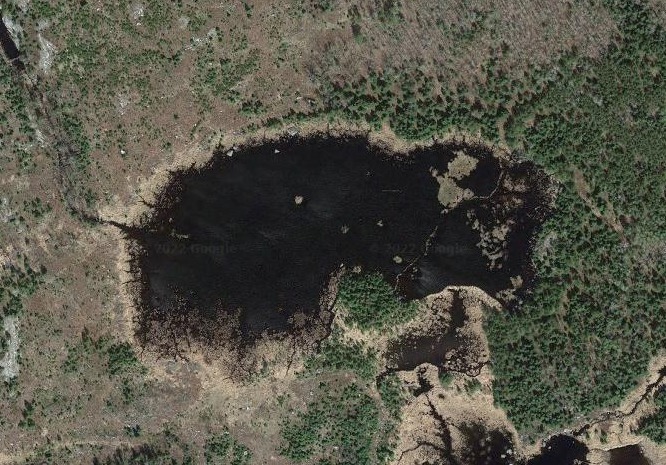
To answer the first question, I needed to choose a study area. I wasn’t going to map EVERY beaver dam in the BWCA, but I needed to map a big enough area to lend perspective. Since this was about the superlative, I also wanted to choose an area with a large beaver population which has been sustained over time. The best I could think of was the very western end. With an intricate network of rivers, streams, and marshes, it’s sort of the perfect beaver habitat. I ended up essentially mapping every beaver dam from Meander Creek to Crane Lake inside of the BWCA border (and including waters which flow into the BW.) I was only mapping dams which were easily discernible on the air photos (about 30 ft long and longer) and this yielded nearly 800 beaver dams in my 42,000 acre study area! Check out the map here.
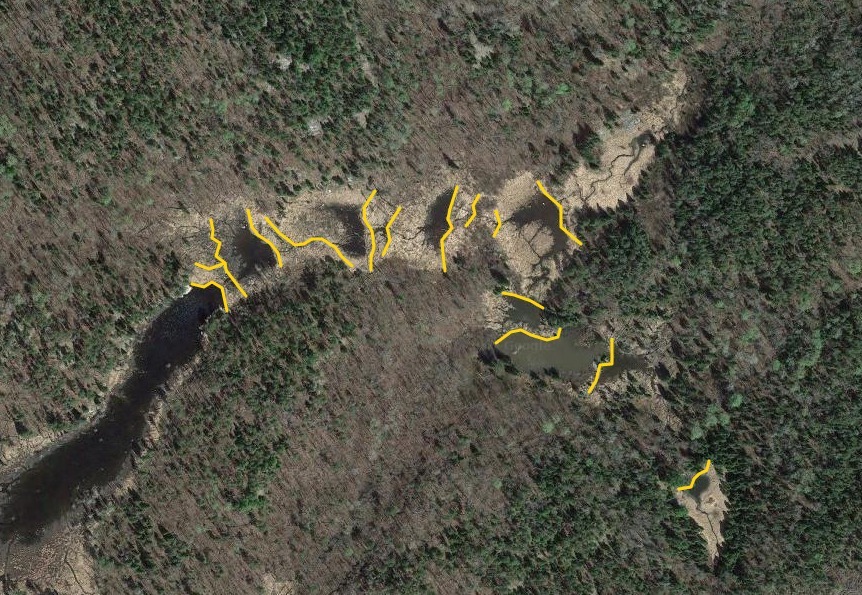
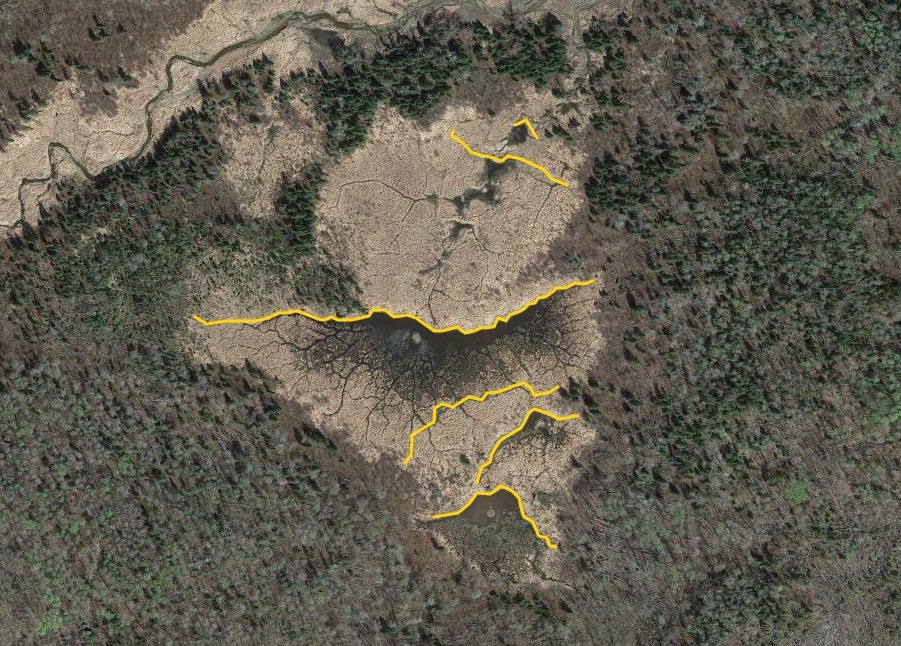
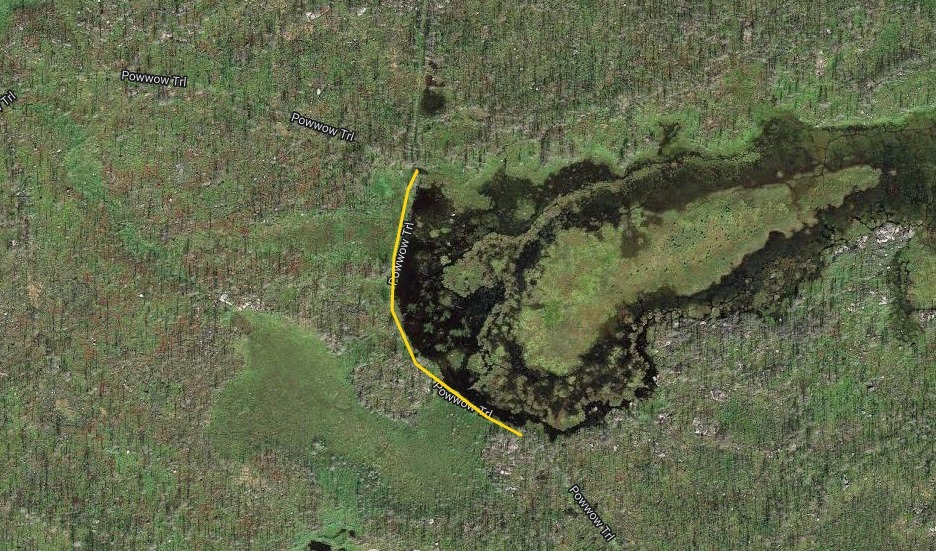
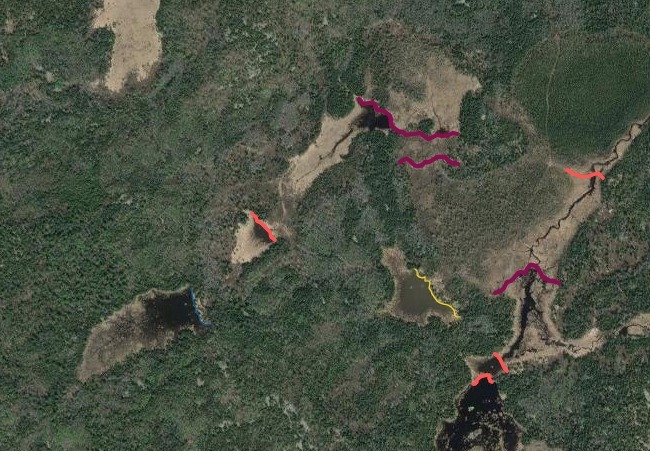
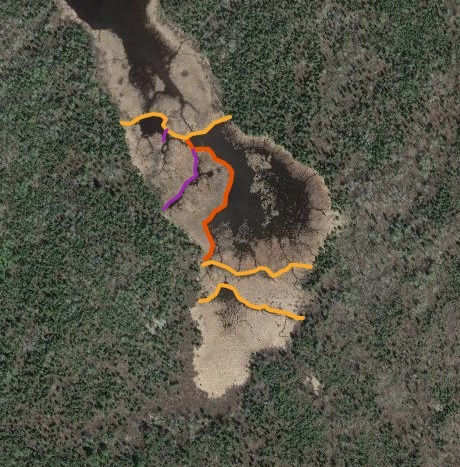
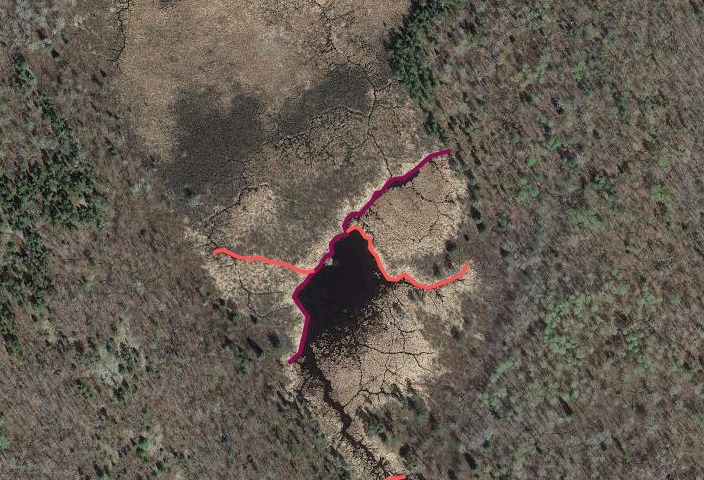
Beyond this, I also wanted to study how large of dams beavers could build and how long those dams last. Incredible articles like this one have described how beaver dams can lest centuries, even a millennia in one case. And this article connected to Wood Buffalo National Park in Canada claims the world’s longest beaver dam at 2542.65 ft long. With those stats in mind, I kept track of every beaver dam in three “large” sizes within my study area and then screened the rest of the BW for other superlatives (though my screening was far from in depth.) The three sizes noted in my data are 4-500 ft, 500-1000 ft, and long than 1000 ft in length. For any dams longer than 500 ft, I delved into a more detailed history including original construction date (if discernible), any notable additions, years of damage (or failure), years of replacement (if applicable), watershed, and an identification number to keep track of each individually. I used multiple historical air photo databases for discovering this data, but my air photos only go back to 1948 for this region. Also, as a bi-product of this study, I learned a lot about different shapes of beaver dams as well as individualism in styles and different beaver families’ preferences for redundancy (building lots of dams to catch every drop of water.) I also learned how to spot beaver dams based on characteristic shapes even more than a century after they were built.
Here are some highlights from the data:
I found evidence of approximately 15 different 1000+ ft dams in the study. Of these, two are “questionable” in terms of “is this whole thing a dam or is it multiple”? Once beaver dams reach the century+ mark, things become increasingly unclear as they essentially become land masses unto themselves with deep soil and trees. Of the 15 suspected 1000 fters, 8 were built before 1948 (and, in some cases, well before.) But some have been built this century already which blew my mind. How can beavers build something that is 1/5 of a mile long in 20 years? Of the less than 1000 fters, there were about 90 between 500-1000 ft and 60 between 400-500 ft. And the watersheds with the most beaver dams over 500 ft? Meander Creek, Nugget Creek, and Gaunt Creek. Probably not surprisingly, Nugget and Gaunt combine to become Beaver Stream which flows into the Loon River. I was blown away again and again by the beavers. Sometimes they built crazy interwoven dam structures which defy my understanding. Sometimes beavers returned 70 or 80 years later and either rebuilt an ancient dam or made a giant connector between old structures. It also seemed like certain beavers were masters at their craft while others were poor at best (and their creations lasted for a comparatively short time.) All in all, it’s incredible the level of impact the Beavers have had considering that, during the fur trade, this population would have been under a tremendous amount of pressure. They obviously have rebounded and what we see today is a very healthy beaver population in the BWCA.
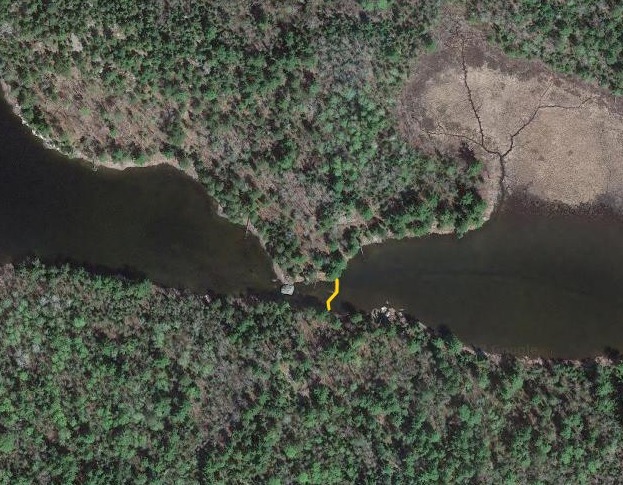
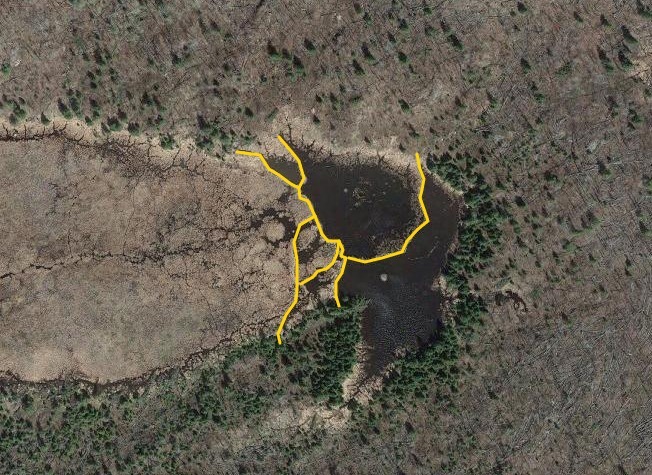
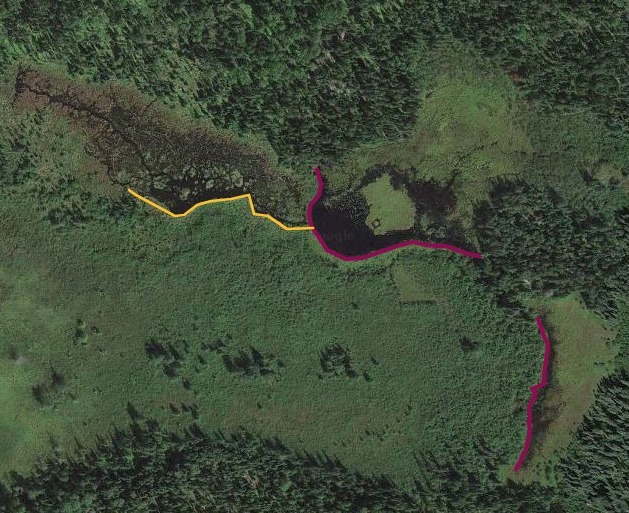
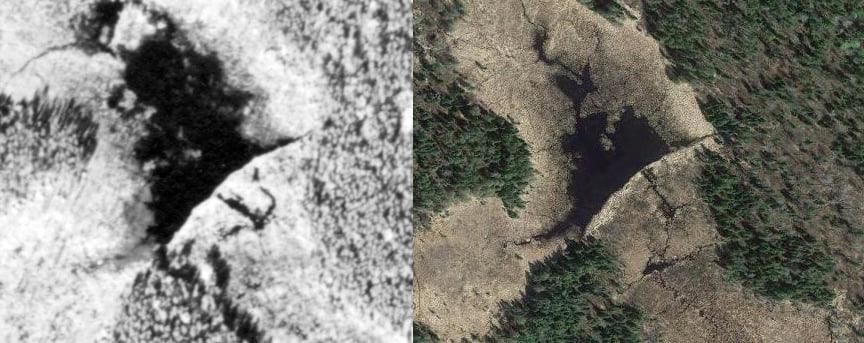
Check out some examples and highlights below from the study.
Thanks for reading.

Sign up for our newsletter to receive updates about new articles, great deals, and information about the activities you love and the gear that makes them possible:
Have You Read Our Other Content?

How Trees Tell the Story of the BWCA
Today is the International Day of Forests which means it’s the perfect day to celebrate the trees of the BWCA. The Boundary Waters are a unique mosaic of forests born out of wildfire, windstorms, logging, and the passage of time. Despite the history of disturbance, the Boundary Waters contain the largest tracts of old growth…
")
From the Boundary Waters to Superior – How the Water Falls
The Boundary Waters are one of the premier destinations in Minnesota and across the Midwest, but, as far as water is concerned, the Boundary Waters are not the end of the journey, but the beginning. Most people enthusiastic about the Boundary Waters know that it is divided into two watersheds along an invisible line known…

Map Mondays – Week 12 – Little Indian North to Moose River North
As part of our continuing series on the “route planning game,” we are creating routes using randomly selected entry points, exit points, and number of days to create unique and fun BWCA routes. This route works through parts of the BWCAW’s far western end from the furthest west EP of the BWCA through big lakes…

Map Mondays – Week 4 – Bower Trout to Little Indian Sioux North
As part of our continuing series on the “route planning game,” we are creating routes using randomly selected entry points, exit points, and number of days to create unique and fun BWCA routes. This week’s randomly selected entry points set us up for a cross-BWCA trip. It’s a long, 10-night trip that covers most of…
")
Map Mondays – Week 10 – Angleworm to Wood
As part of our continuing series on the “route planning game,” we are creating routes using randomly selected entry points, exit points, and number of days to create unique and fun BWCA routes. Let’s check it out! Total Mileage: 45.5 milesNights: 5Paddle Distance: 36.7 milesPortage Distance: 8.7 miles Day 1: Miles: 7.6Target Campsite: Thunder LakeDescription:…

The Comprehensive Guide to Portaging Like a Pro
We all took our first portage somewhere. From those first tender rods on wobbly legs, we each struggled to carry all our gear from lake to lake. For many of us, this was also a time of questions: “Why did I bring so much gear?”, “Why is my canoe so heavy?”, “Am I in good…

2022 Border Challenges
Everywhere one walks and paddles in the BWCA there is a unique connection with the past. Every lake, every portage is filled with stories of legendary figures and lives lived. And through those stories come the marvelous tales of adventure and achievement born of adversity and hardship amidst the beauty. This coming week, a…

10 Tips and Tricks for Nightime Canoe Travel
The vast majority of BWCA visitors paddle and hike during daylight hours and for good reason. It’s safer, there’s more to see, and daylight travel aligns with normal sleep cycles. Night travel, on the other hand, provides a higher risk of getting lost while paddling; it’s also easier to fall and get hurt while portaging.…
")
Let’s Break the Ice on a BWCA November Canoe Trip!
It’s been snowing all week here in Ely which points to a winter season fast approaching. In the meantime, this is one of the more challenging seasons for wilderness travel with many big lakes still open, smaller lakes starting to freeze, and trails and forests covered in fresh, wet snow. To the majority of…
")
Echoes of ’93 – Managing a Complicated Wilderness
“There is currently too much visitor use in some areas of the BWCAW on some days. Excessive use results in the following impacts: Off-site camping on non-designated sites which impacts vegetation, soils, and heritage resources. Some designated campsites and portages are too heavily impacted based upon our LAC inventory data. Approximately 85% of all existing…